July 30, 2012
Riak’s vision is to “be the best organization in the world.” This vision applies to every aspect of Riak as a company, including the quality of our products, our culture and of course our customer support. We strive to provide the best customer support possible.
We have chosen Zendesk as our help desk platform given its ease of usability, customization, integration with other tools, and API. In our journey to dive into our deluge of now almost 2 years of accumulated Zendesk data, I first ventured over to Zendesk’s API page to check out the existing clients. Currently, only a Ruby client is listed but a Python library also exists.
As a data scientist desiring to do some complex analytics on our customer support data, I was stunned that no one had yet developed an R wrapper for Zendesk! Having used R since 2005 (mainly to analyze genetic and genomic data) as well as plenty of its libraries and the mailing list (often), I realized this was finally my chance to give back to the open source community, which is also very much in alignment with Riak’s commitment to open-source software.
So I wrote a Zendesk API wrapper in R called zendeskR (code on github).
As of this blog posting, zendeskR v0.2 supports 6 different API calls:
These calls access the data types that I was analyzing most often, but I will add more features, as well as update and maintain the package regularly. If there is an API call you would like to see supported, please feel free to shoot me an e-mail at the address noted in the package description.
The analytic possibilities are nearly endless by having all of this data in R. Some example questions that an organization could begin to answer with this data are:
- What is the average time to close a ticket for each customer?
- How many comments were posted to a ticket before it was finally resolved?
- How much does it cost to support customer X based on support and engineering time?
- Using sentiment analysis and a text corpus, what are the most frequently used words for tickets that receive a Good Satisfaction rating versus a Poor Satisfaction rating?
- Based on past trends, how many tickets will open this month?
- What is a developer advocate’s ticket closing rate and satisfaction rating?
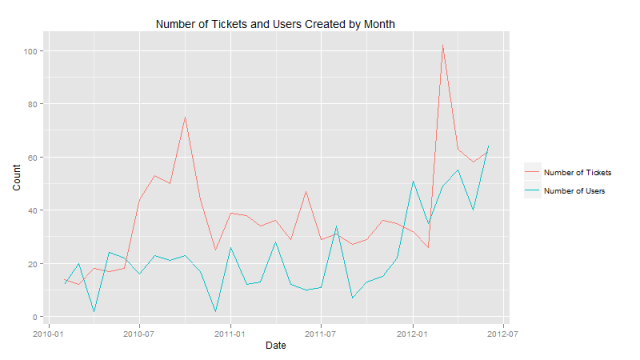
Here’s a simple charting example that displays the number of tickets and users created by month.

To install zendeskR from CRAN, open an R console and type:
The analytical opportunities as described above are almost endless and at Riak we have only begun to scratch the surface. Ultimately, we aim to provide the highest quality products possible coupled with the best customer support system in the world, which is partially achieved by data-driven customer support system optimization strategies. Aim high.

