Riak TS 1.3 launch is just days away and since 1.3 will include the first Open Source release we thought we’d set the stage, give you access to some fun time series data and guide you through an example of a practical Riak TS use case. This demo shows how Riak TS can be used for analysis of historical time series data being generated by sensors to predict the occurrence of an event.
Our goal is to predict the presence of a baseball game at Dodgers stadium using the traffic data from ramp sensors on the 101 North freeway in Los Angeles. The dataset used can be found here. The ramp is close enough to the stadium to see unusual traffic after a Dodgers game. But not so close, and therefore heavily used by game traffic, so that the signal for the extra traffic is overly obvious.
First, let’s create the tables for the sensor data and the event data respectively. We can use the following schema for the data we have
CREATE TABLE SENSOR_TABLE (
	ramp varchar not null,
	city varchar not null,
	daytime timestamp not null,
	count double,
	PRIMARY KEY((ramp, city, quantum(daytime, 60, d)), ramp, city, daytime))

CREATE TABLE GAMES_TABLE (home_team varchar not null,
	home_team varchar not null,
	city varchar not null,
	date_begin timestamp not null,
	date_end timestamp not null,
	attendance sint64,
	away_team varchar,
	PRIMARY KEY((home_team, city, quantum(date_begin, 60, d)), home_team, city, date_begin))
After creating the tables, we bulk load the data in the database using the store api.
For example in Python:
table = rc.table(GAMES_TABLE)
ts_obj = table.new(events_raw.values.tolist())
result = ts_obj.store()

table = rc.table(SENSOR_TABLE)
ts_obj = table.new(traffic_df.values.tolist())
result = ts_obj.store()
Next we query the data using select queries to see how the traffic data plots against the event data.
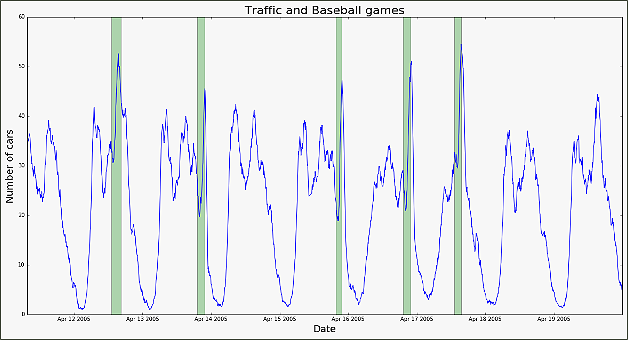
Let’s now fetch some of the data and see how it plots
We can use the following queries and plug in dates for t1 and t2
select daytime, count from {table} where daytime > {t1} and daytime < {t2} and ramp = '101 North freeway' and city='LA'
select date_begin, date_end, attendance from {table} where date_begin > {t1} and date_begin < {t2} and home_team = 'Dodgers' and city='LA'

We can see that traffic peaks are following game events.
Now let’s build the model. We chunk the data in one-hour interval and extract features – mean, min, max, standard deviation and median traffic along with whether there was a game in this time interval. We then randomly split the data between train and test sets and use the Random Forest Classifier model to fit the data.
RandomForestClassifier(bootstrap=True, class_weight=None, criterion='gini',
max_depth=None, max_features='auto', max_leaf_nodes=None,
min_samples_leaf=1, min_samples_split=2,
min_weight_fraction_leaf=0.0, n_estimators=100, n_jobs=1,
oob_score=False, random_state=None, verbose=0,
warm_start=False)
With this model we get an accuracy score of 0.94 which indicates that we can quite accurately predict a game based on sensor data. A similar approach can be used for other machine learning problems. You can find the notebook for this demo here.
Riak TS is the only enterprise-grade NoSQL database optimized for IoT and Time Series data. It will ingest, transform, store and analyze massive amounts of time series data. We are seeing some very exciting performance data from our testing – Riak TS is so much faster Cassandra in our performance testing!
Looking forward to your feedback on Riak TS. Please visit riak.com/products/riak-ts/ to find out more information and take the new Riak TS Tour that you can navigate to from that page. If you’d like to find out more information or schedule a tech talk send us an email here.
Seema Jethani
Riak Product Manager
@seemmaj

