Running a high-throughput distributed infrastructure means paying close attention to a wide variety of metrics.
I am Geoff Clark and as a member of the Operations team at Tapjoy, it’s our job to ensure we scale and tune our infrastructure to meet that demand. It’s also important to make sure those systems are available. Riak KV provides the scalable, high-performance database that we rely on to meet our uptime goals. We grow our Riak KV cluster as our infrastructure grows, since an increased workload from new applications means more I/O to Riak KV. Keeping the demand for application performance in balance with the size of our cluster is crucial. This makes monitoring Riak KV an important part of my job.
As our cluster has grown over time, our ability to diagnose and address production issues improved through necessity. Metric collection at intervals of 1 to 5 minutes were once sufficient for applications. When working with Riak – a core component of our services – we wanted greater granularity. It’s crucial that, within seconds, we know what impact an increase in user traffic or configuration change may have on the cluster. In addition, we wanted the ability to see both aggregated data as well as individual node metrics, all in one place.
We found SignalFx, set it up and we’ve been happy with the results. If you want to learn more about our choice of SignalFx, you can read more here. This post is how we configured Riak KV to send metrics to SignalFx in case you want to do the same.
Configuring Collectd
SignalFx supports a variety of channels through which you can ship metrics. Our method of choice is collectd. It’s a lightweight client that can be installed on every node to support a wide variety of community plugins, and collection methods. Collectd is baked into all of our AWS AMIs. We use Chef to apply configuration changes on running nodes such as editing plugins and metrics. We use the recommended write_http plugin to send metrics to SignalFx:
For our Riak cluster, we apply the curl_json plugin with the configuration provided by Riak to collect metrics from the HTTP stats endpoint available here: https://docs.riak.com/riak/1.4.8/ops/running/monitoring/collectd/#Configuring-collectd:
With this template, we get a great baseline for metric collection. Running a riak-admin status command will give you an excellent idea of what metrics can be collected. Additionally, our cluster is configured for Multi-Datacenter Replication. Valuable replication metrics are available from the riak-repl stats endpoint.
Generating Graphs in SignalFx
Once we have metrics configured and shipping to SignalFx, we’re in good shape. The datapoints are showing up in a Catalog. Generating graphs and dashboards is the next step. In our case, we have two Riak dashboards – one for each AWS Availability Zone. Let’s take a look at setting up a graph that aggregates the overall vNode Puts and Gets for a cluster in Availability Zone us-east-1d.
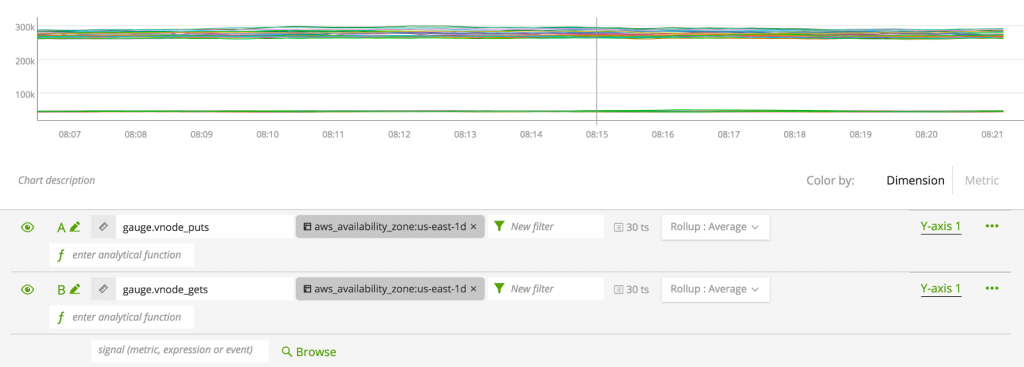
Knowing the name of the metric is helpful, but if you don’t, the search features in SignalFx is quite useful – it includes several methods for wildcard searching. We found the vnode_puts and vnode_gets which are both coming in as a gauge type:
This graph is not useful to us in its current state for a few reasons. First, it’s all 60 of our nodes. Lets apply a filter. Since SignalFx will also integrate with AWS metrics we can use any EC2 filters or tags. Here we apply the aws_availability_zone to use us-east-1d:
Seeing individual node metrics might be useful but in our example we really want to see the cluster activity as a whole – a sum of this data:
Ok, how did we get here? We added an analytical function for Sum > Aggregation which adds all node data together. We also changed the graph type to be Area instead of Line. This causes them to be filled with color for a better visualization of “Sum”. Then, we changed the “Color By:” to be Metric instead of Dimension which varies based on your collection methods. Things are looking great now, but are they accurate? Take a look at the numbers. 5 million gets seem high?
The color changed – yes – but also we applied a scale of 1/60. After reviewing Riak documentation for Riak stats, the puts and gets are collected in 1 minute intervals. Since we want the SignalFx graph in per second rates, this scale converts the numbers accordingly.
SignalFx filters and analytical functions are powerful and extensive. The ability to adjust and manipulate data also makes our collection mechanism – Collectd – very simple.
Implementing Detectors
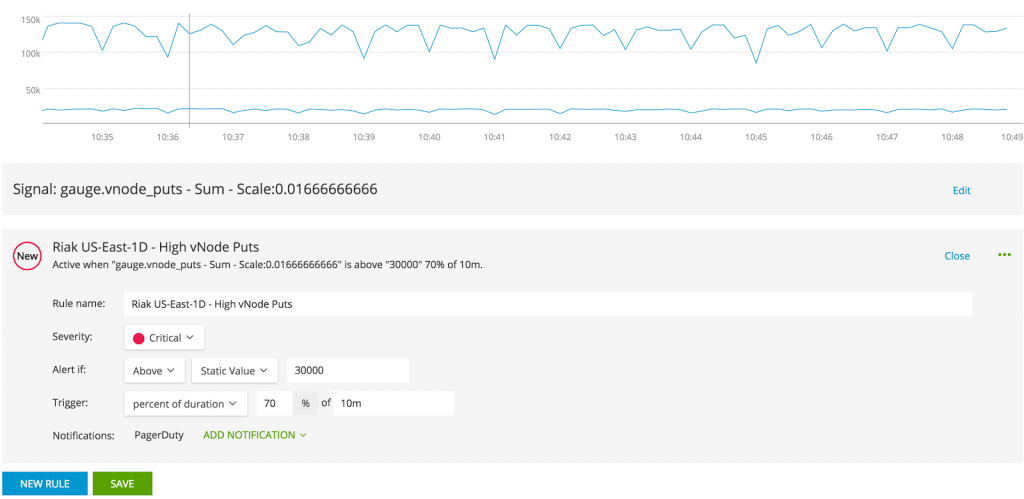
From here, we can create meaningful thresholds that act as triggers for other activity, like notifying us. These are called detectors. Taking the previous example, creating a detector for put operations exceeding some determined high water mark is simple:
Creating a rule based on the metric (signal) gauge.vnode_puts we can see some of the available options. In this case, we are going to send an alert to PagerDuty if we exceed 30000 vNode Puts for 70% of a 10 minute duration. This is a great way for taking noise out of a graph and keeping those Ops pages to a minimum. Detector rules have great flexibility. They can be as simple as a static value and static duration, to dynamic values based on other metrics, and percentages of durations. This is for you to explore as your monitoring and internal systems change.
Real-time Metrics Make the Difference
For Tapjoy, the benefit of SignalFx is that it promises data visualization with up to the second granularity. Think about how empowering this immediate feedback is for our developers and Ops team alike. We know when we’ve sent too much traffic to our existing cluster at exactly the time an issue occurs. And when a single node is having an issue out of two datacenters, we know within seconds as well. Previously we were responding to application slowdowns after a 5 to 10 minute delay. By the time we detected the production issue and traced it back to a configuration change or instance failure, however rare, in our Riak KV cluster, we were already experiencing application downtime. In our work at Tapjoy, that time is easily calculated into tens of thousands of dollars. Now we know in just a few seconds. In many instances has resolved cluster issues before seeing an application-level concern.
My coworker discusses more on how SignalFx works for us as well as how Riak KV enables our mobile strategy. We’re excited to use both these technologies to empower our DevOps practices.
Geoff Clark
Senior DevOps Engineer at Tapjoy


